SUMMARY
Sometimes it can be difficult to quickly get to a full 360-degree view of the converter’s operation, including both production and business elements. That’s why HiFlow developers have placed a strong focus on developing a highly visual representation of a company’s operations, including customizable dashboards, job production, a SCADA monitor and reporting and analytics.
The Dashboard Difference
HiFlow’s Multi-panel Dashboard System is a real-time visual representation of packaging manufacturing processes. With HiFlow’s Multi-Panel Dashboard System, users can track KPIs in real-time using data from sources including people, machines, ERPs, and HiFlow’s MES system. This provides a holistic overview of operations by collecting feedback such as downtime, quality control, inventory, etc. With this at-a-glance approach, management can monitor critical KPIs and react to problems as they occur.
Dashboards enable complete visibility of production and are a powerful analytics tool to manage manufacturing costs efficiently. HiFlow 4.0’s Dashboard system, integrated with Microsoft’s PowerBI, offers visibility of processes in real time. Through HiFlow’s Dashboards, organizations can quickly see their current and historical performance and are able to make informed decisions.
The image below is an example of visual workflow for a typical job:
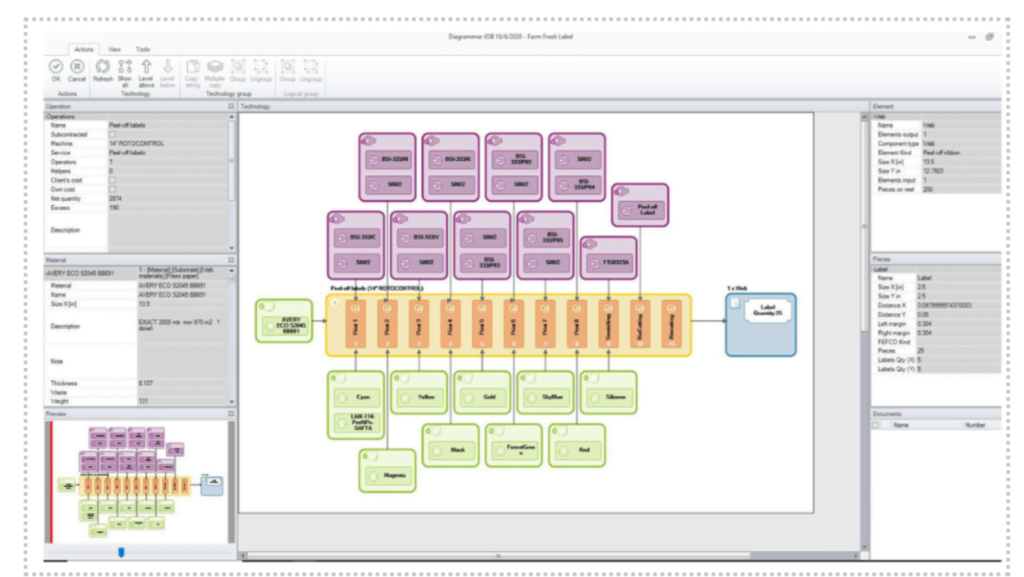
Within the HiFlow workflow, once an estimate becomes a job, the Job Production Workflow is automatically created in the system. A single, user-friendly representation, on a single screen, it provides a visual image of the workflow and includes all job data. This helps users understand the overall flow of the process, visualize process dependencies, and identify potential bottlenecks or inefficiencies. Authorized users see a graphic of the entire workflow, from pre-press through production, and can click on each process to get any additional details on the job. Instead of handling paper tickets, or re-keying text or data, the Job Production Workflow displays a job’s materials, machines, processes, and people. This ensures consistency and accuracy for everyone who needs to interact with the job.
The information from the job is then stored in HiFlow’s central database where the job is continually updated with data – from customer service, from any changes in planning, from any adjustments to scheduling and production—providing high levels of automation, reducing time, labor and opportunity for error. It also eliminates the need for staff to run around the plant looking for updates that might be requested by customers. Instead, the customer service rep can simply pull up the visual workflow and have instant access to all required information.
SCADA Monitor Benefits
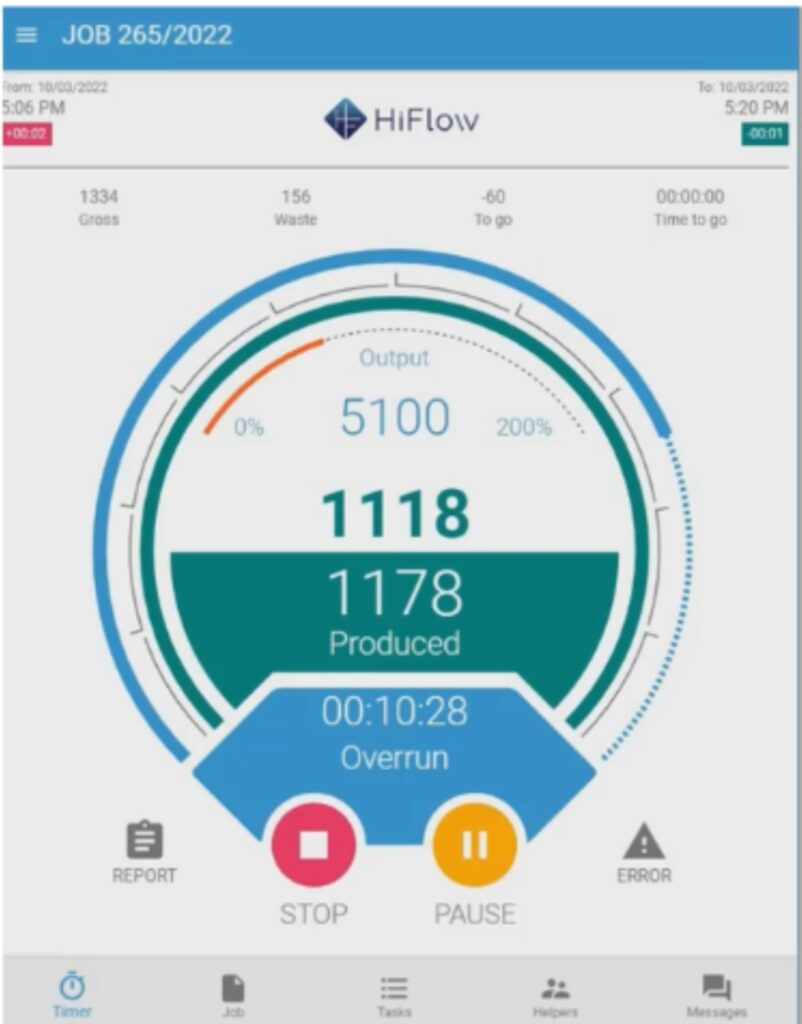
HiFlow also offers a SCADA monitor – supervisory control and data acquisition — a system of software and hardware elements that allows manufacturers to control production processes locally or remotely. The SCADA monitor gathers data in real-time by directly interacting with devices such as sensors, machines, equipment and more through human-machine interface (HMI). It eliminates the need for manual entry of job statistics such as the number of sheets run, the production time, downtime, waste, etc., as depicted below, providing a more accurate real-time view of the production operation:
All-Important Real-Time Reporting, Analytics
HiFlow uses Power BI to provide visuals. A user can connect to and visualize any data and be able to transfer it into apps used every day.
Managers can create a variety of reports and collaborate with teams using HiFlow’s BI. They ca use a wizard to create a table, design a paginated report, and interact with visuals directly on mobile screens. Authorized users can also create highly configurable dashboards that provide access to exactly the data that is required for their particular job performance.
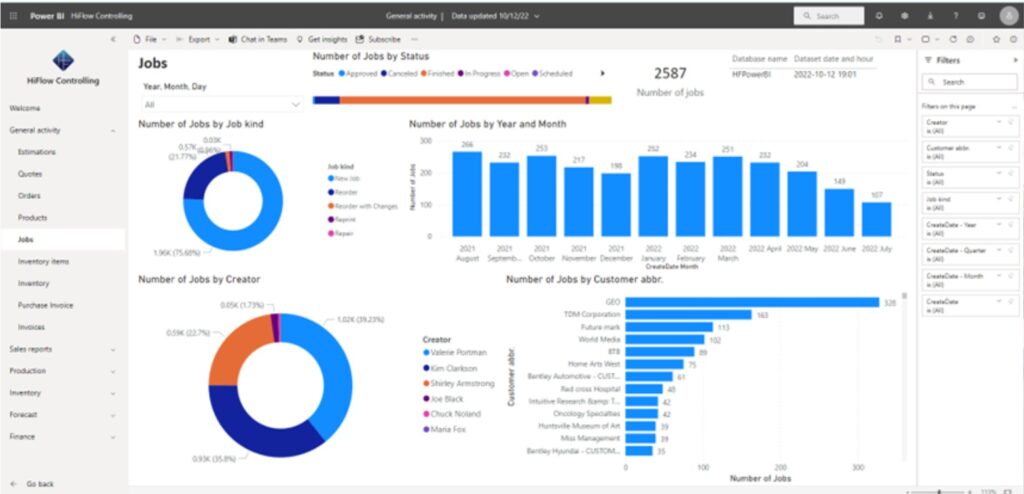
HiFlow’s BI transforms complicated information into something that’s easy to share and understand. It simplifies big data analysis with intuitive tools that quickly and securely leverage data with real-time accuracy and consistency for better business decision making.

+ Connect with us and feel free to leave a comment on one of our channels.
Additional articles you might find valuable

Bridging the Gap: Leveraging an ERP/MIS to Mitigate Skilled Labor Shortages
SUMMARY The skilled labor shortage has become a significant challenge across various industries, with sectors like manufacturing, logistics, and packaging feeling the impact most acutely. As the demand for skilled labor continues to outpace supply, organizations are...

Shop Floor Scheduling: Are You Getting the Most out of Your Plant’s Production Capacity?
SUMMARY Summary: SEMrush data from 2024 shows that companies integrating advanced scheduling technologies experience a 25% increase in production efficiency. Getting the most out of your plant’s capacity means implementing a robust ERP that helps plan, execute, and...

Quoting made simple: HiFlow’s Packaging Design and Imposition Modules
SUMMARY Packaging converters face numerous challenges, including the need for faster production times, the ability to quickly change designs, saving time in the estimating process, getting quotes out faster. HiFlow Solutions’ ERP/MIS system offers capabilities like a...